Running the Fledge GUI
Fledge offers an easy-to-use, browser-based GUI. To access the GUI, open your browser and enter the IP address of the Fledge server into the address bar. This will display the Fledge dashboard.
You can easily use the Fledge UI to monitor multiple Fledge servers. To view and manage a different server, click “Settings” in the left menu bar. In the “Connection Setup” pane, enter the IP address and port number for the new server you wish to manage. Click the “Set the URL & Restart” button to switch the UI to the new server.
If you are managing a very lightweight server or one that is connected via a slow network link, you may want to reduce the UI update frequency to minimize load on the server and network. You can adjust this rate in the “GUI Settings” pane of the Settings screen. While the graph rate and ping rate can be adjusted individually, in general you should set them to the same value.
Fledge Dashboard
|
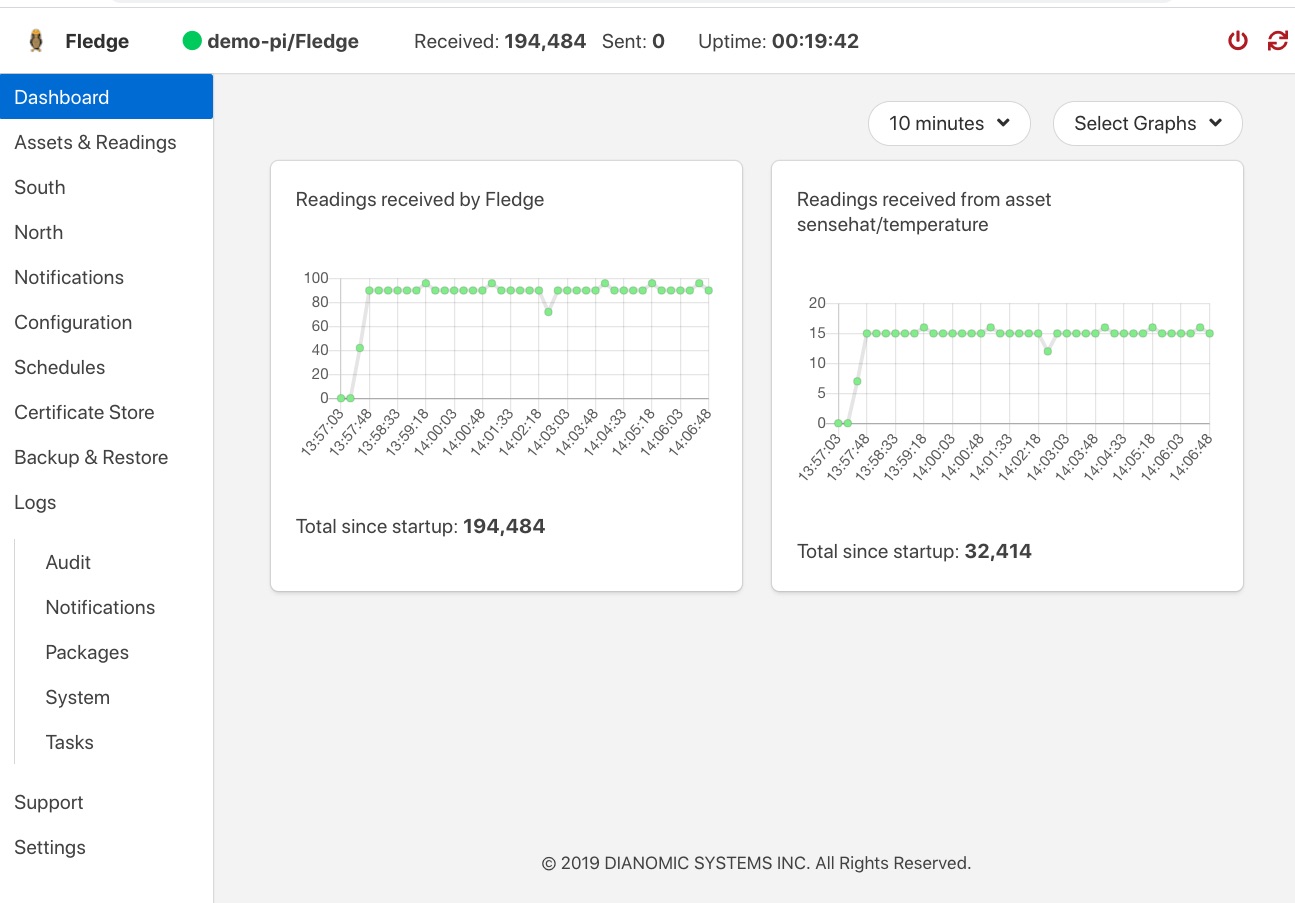
This screen provides an overview of Fledge operations. You can customize the information and time frames displayed on this screen using the drop-down menus in the upper right corner. The information you select will be displayed in a series of graphs.
You can choose to view a graph of any of the sensor reading being collected by the Fledge system. In addition, you can view graphs of the following system-wide information:
Readings: The total number of data readings collected by Fledge since system boot
Buffered: The number of data readings currently stored by the system
Discarded: Number of data readings discarded before being buffered (due to data errors, for example)
Unsent: Number of data readings that were not sent successfully
Purged: The total number of data readings that have been purged from the system
Unsnpurged: The number of data readings that were purged without being sent to a North service.